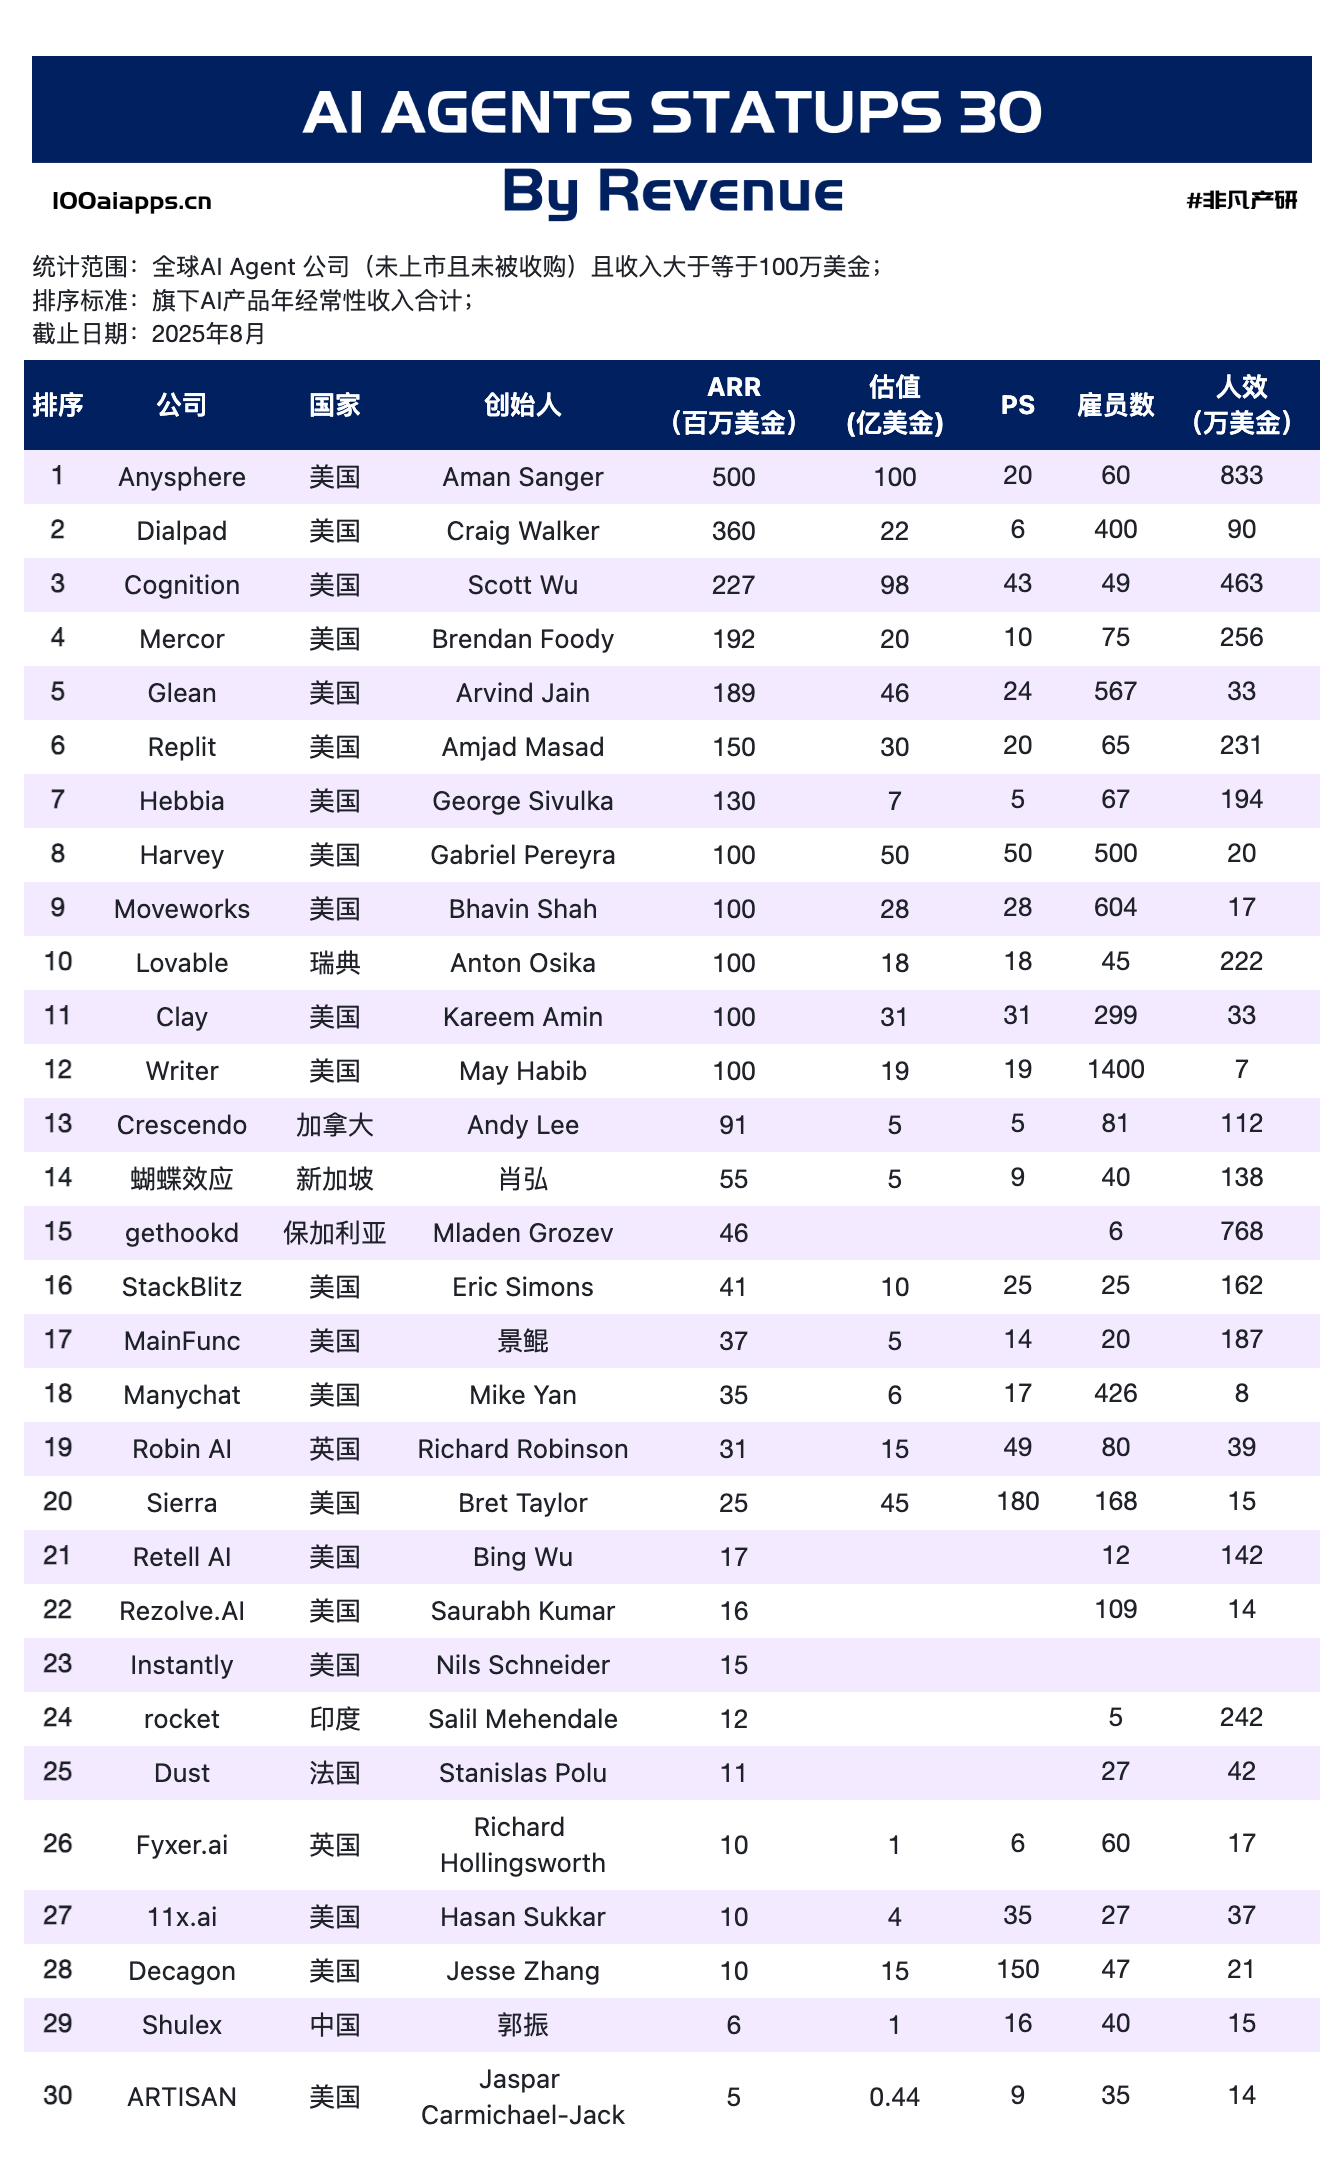
If 2024 was the "first half" of AIGC's popularization, then the "second half" in 2025 has been taken over by deployable and deliverable AI Agents. This Top 30 list offers a rare "sample slice" into who's truly making money, who's securing strong valuations, and who is finding a stable balance between operational efficiency and scale. By looking at these 30 companies together, we can more calmly answer three questions: Why are they able to make money? Why are investors giving them a premium? What do they have in common?
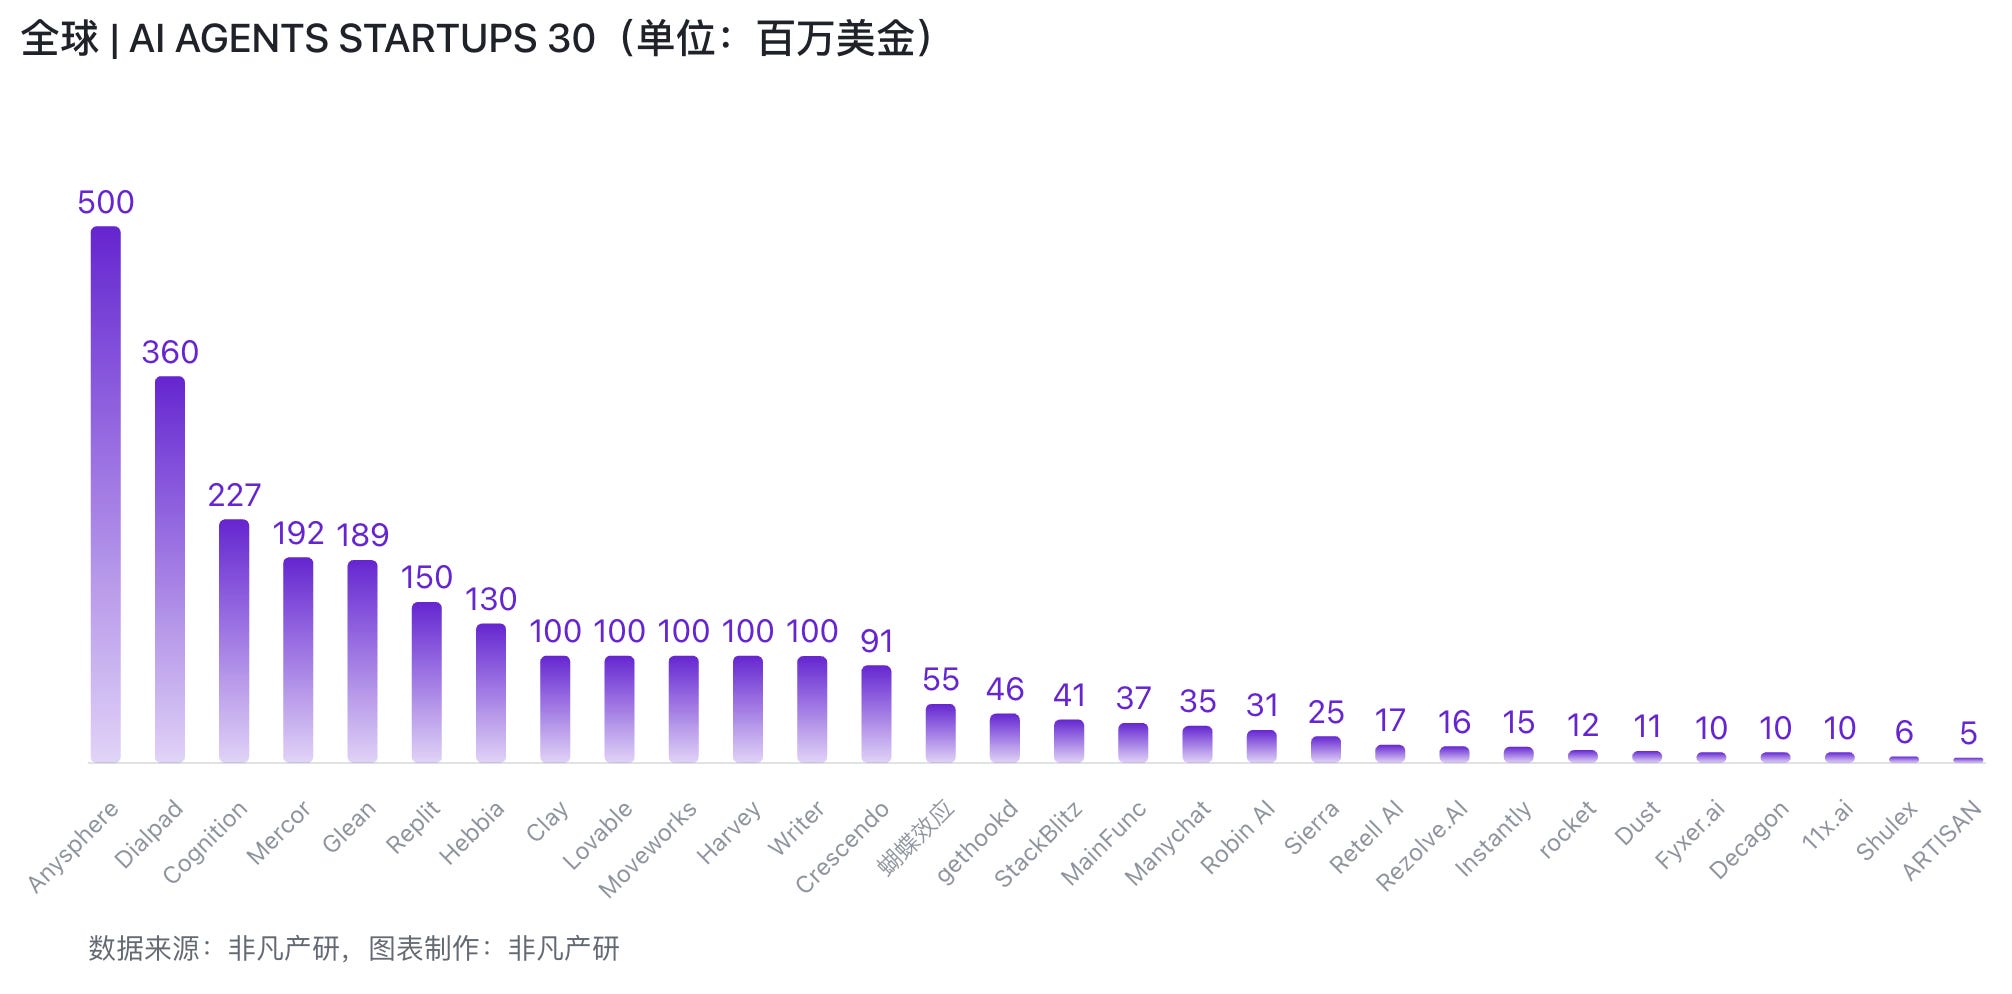
Total Scale: The combined ARR (Annual Recurring Revenue) of the Top 30 is approximately $2.72 billion USD; the median ARR is $50.5 million USD.
Head-heavy Concentration: The top 5 companies contribute 52% of the total ARR, while the top 10 contribute 72.7%.
Tiered Distribution: 12 companies have an ARR of ≥$100 million, 2 have an ARR of $50–100 million, 14 have an ARR of $10–50 million, and 2 have an ARR of <$10 million.
Geographic Structure: 21 out of 30 companies are from the United States, contributing approximately $2.454 billion USD (~87%) of the ARR. The remaining countries (Sweden, Canada, Singapore, Bulgaria, UK, India, France, China) account for a combined ~13%.
Valuation and Multiples: The 21 companies with disclosed valuations total ~$58.6 billion USD. The median P/S (Price-to-Sales) ratio is ~20, with a mean of ~34.
Operational Efficiency & Scale: The median "efficiency" (ARR per person) for the entire sample is ~$900,000 (i.e., an average of ~$900,000 ARR per person). The median for the ≥$100 million ARR tier is ~1.23 million, while the median for the $10–50 million tier is ~$390,000.
Extreme Observations:
Highest Efficiency: Anysphere (~$8.33 million/person) and gethookd (~$7.68 million/person).
Highest P/S: Sierra (P/S ≈ 180) and Decagon (≈150)—capital is "buying the future" with extremely high multiples.
Low P/S Samples: Hebbia/Crescendo (P/S ≈ 5) and Dialpad (P/S ≈ 6)—these are either more mature or more strongly oriented toward cash flow.
These numbers give us an initial, intuitive impression: a profitable agent must be able to leverage high-value use cases while keeping its operational efficiency high. The preference of capital clearly shows a tiered pricing approach at different stages.
Based on their names and general knowledge (understanding that doesn't go beyond the information in the list), leading companies largely focus on scenarios that are high-frequency, high-value, and have strong, quantifiable results. These include:
Development and knowledge work (Anysphere, Cognition, Replit, Lovable, StackBlitz, etc.)
Enterprise knowledge retrieval/insights (Hebbia, Glean)
IT/collaboration support (Moveworks)
Transactional professional services (Harvey/legal)
Voice communication work (Dialpad/Retell AI)
The common feature of these scenarios is their short and quantifiable feedback loop (they can be directly mapped to a clear ROI like "hours saved / output increased"). This makes it easier to secure stable payments and repeat purchases.
Supporting Data: The median ARR per person for the ≥$100 million ARR tier is ~$1.23 million, significantly higher than the $10–50 million tier (~$390,000). This proves that finding the right single-point use case, creating a replicable closed loop, and scaling it up can indeed boost operational efficiency.
Within the Top 10, Anysphere has a $500 million ARR with only ~60 people, resulting in an efficiency of ~$8.33 million per person. Get hooked has a $46 million ARR with ~6 people (~$7.68 million/person), and Rocket has a $12 million ARR with ~5 people (~$2.42 million/person).
These examples show us that by aiming for a "self-running product" from day one, encapsulating professional capabilities into reusable "task chains," and minimizing the "human-dependent sticky points" in delivery, you can achieve high efficiency and healthy cash flow. This, in turn, creates a positive feedback loop where profits fuel product development, and the product further improves efficiency.
There's a negative correlation between P/S and ARR (the sample correlation coefficient is approximately -0.30): the median P/S for the $10–50 million ARR tier is ~35, while it's ~20 for the ≥$100 million ARR tier. This mirrors the pricing logic of early/mid-stage SaaS: the earlier and faster the growth, the higher the multiple capital gives; once scaled, the multiple converges toward "operational quality and cash flow efficiency."
The extreme examples of Sierra (P/S ≈ 180) and Decagon (≈150) are clearly "telling a story of a longer growth trajectory," while lower-multiple companies like Dialpad, Hebbia, and Crescendo resemble a more mature, "cash flow-based valuation" path.
The concentration of the Top 5 (~52%) and Top 10 (~72.7%) suggests that a "winner-take-all + platform-like" trajectory is already taking shape. For latecomers, the "differentiated wedge" must be much clearer.
The sample correlation coefficient between ARR and efficiency is ~0.54. Companies that can scale more effectively are also more likely to have a "leaner" organization. This is highly consistent with the "automated" product form of many agents.
Capital multiples favor a "steep early curve" over a "large current size." This requires founding teams to not only build a "strong closed-loop" product but also to prove its growth rate and replicability.
The US accounts for 70% of the companies and over 80% of the ARR. This is not a matter of geography but a combination of market maturity, customer willingness to pay, talent structure, and infrastructure. For companies in any non-US market, these variables need to be "engineered" to catch up.
The agent's unit of capability should be defined as the shortest possible path from input to business outcome. Every manual intervention removed creates more room for efficiency. The high-efficiency companies in the sample can almost all be mapped to a short, closed-loop process.
Not all automation is worth pursuing. Prioritize breaking into the quadrant of "high-value (saves expensive labor or drives revenue) x high-frequency (scalable and reusable)." The common thread among the Top 10 is that they all fall into this quadrant.
Early Stage: Emphasize the growth slope and future potential (replicability), which can lead to higher market multiples.
Later Stage: Focus on operational quality (gross margin, payback period, net retention). The multiple will naturally decrease, but the valuation will be more solid.
This isn't just a funding strategy; it also guides the product roadmap and go-to-market strategy (e.g., PLG vs. direct sales, horizontal expansion vs. vertical deep dives).
Many of the "high-efficiency" companies on the list clearly design their organizations with the idea of "using the product to offset human-related friction." Any manual process that can be productized or tool-chained is eliminated. This allows them to maintain a flat (or even declining) efficiency curve as their ARR grows.
Refine one "result" to the point where users are "willing to pay for it long-term" before adding more tasks or expanding boundaries. Spreading too thin too early will cause efficiency to collapse.
If you can help customers clearly link your agent to "which part of the headcount was saved / how much output was gained," your pricing can increase and your P/S will be healthier.
Development/knowledge work, IT support, legal/compliance, and voice agents/call centers are all verticals on this list that have proven to be "willing to pay + highly reusable." Identifying a niche audience and vertical data provides the foundation for international expansion and scale.
The most fundamental consensus among these 30 companies is a shift from being "able to write" to being "able to do." When a task can be closed-loop, when a result can be quantified, and when the product makes the organization leaner, efficiency is no longer an "industry average" but your own "compounding curve." And capital is more willing to buy the slope of that curve.
In 2025, the competition for agents is no longer about "piling on models" but about "who best understands how to organize capability into a reusable business outcome that can be consistently sold."
This is the AI Agent Revenue Ranking for July 2025, published by Fanfan Research, which tracks the global Top 30 private AI Agent companies with revenue greater than or equal to $1 million USD.
We believe in the power of open-source and transparency, and Fanfan Research makes the following three commitments:
This AI product ranking is permanently open-source and free, with the complete methodology and raw data available for full replication.
The data sources for this AI product ranking are strictly limited to independent third-party monitoring platforms. We do not accept self-reported data from companies as a basis for evaluation.
The ranking system is completely neutral. We do not accept any commercial collaborations or paid activities that could influence the ranking results.
For the full data behind the charts and rankings shown in this article, please visit 100aiapps.cn. All visible data can be copied and is free for personal use, such as learning and research. For any commercial use, please contact Fanfan Research for prior authorization. We also welcome valuable feedback and suggestions from our industry peers. Thank you for your support!