On September 16, 2025, Goldman Sachs published figures claiming that as of August 2025 the global ARR of AI applications is ~$30B, with China at ~$1.5B, and ~80% of China’s ARR coming from overseas markets. The numbers looked familiar—but the report didn’t say which apps they were based on.
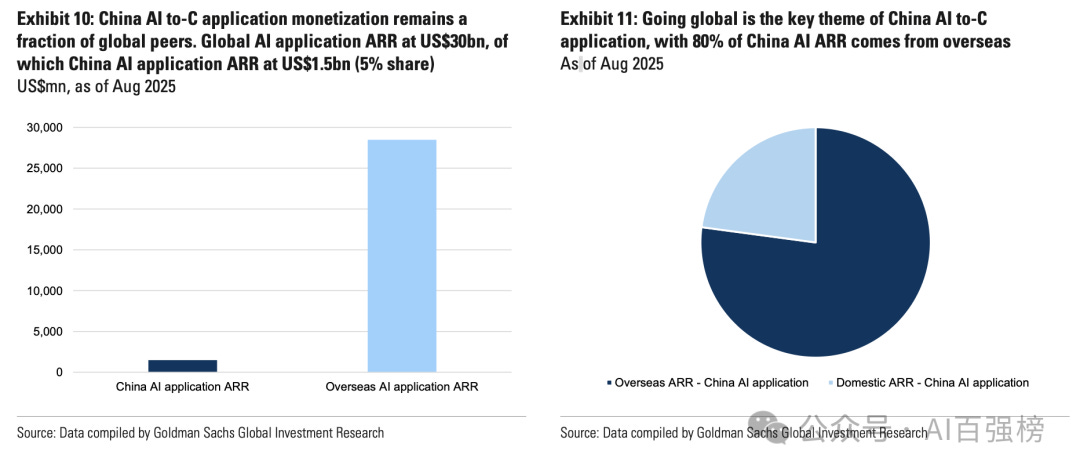
So we checked the AGI Intelligence Hub at UNIQUE RESEARCH (非凡产研). Using our dataset of 420 products worldwide with ARR > $1M, the dashboard (screenshot previously shared) showed a structure strikingly similar to Goldman’s. That screenshot used July 2025 data. Below is our updated cut for August 2025—a revenue map that aims to mirror reality across Overseas / China / China-going-global segments.
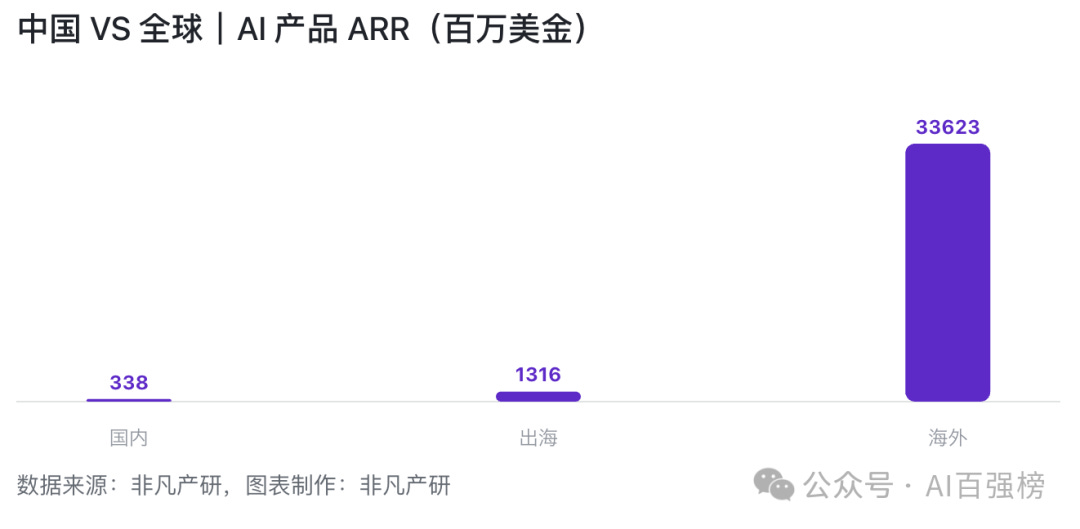
Global ARR (products > $1M ARR): ~$35.276B
Overseas products: ~$33.62B
China products: ~$1.658B
Domestic (China-only): ~$0.338B
China going-global: ~$1.316B
Share of China’s ARR from going-global products: 79.37% (very close to Goldman’s “~80%”)
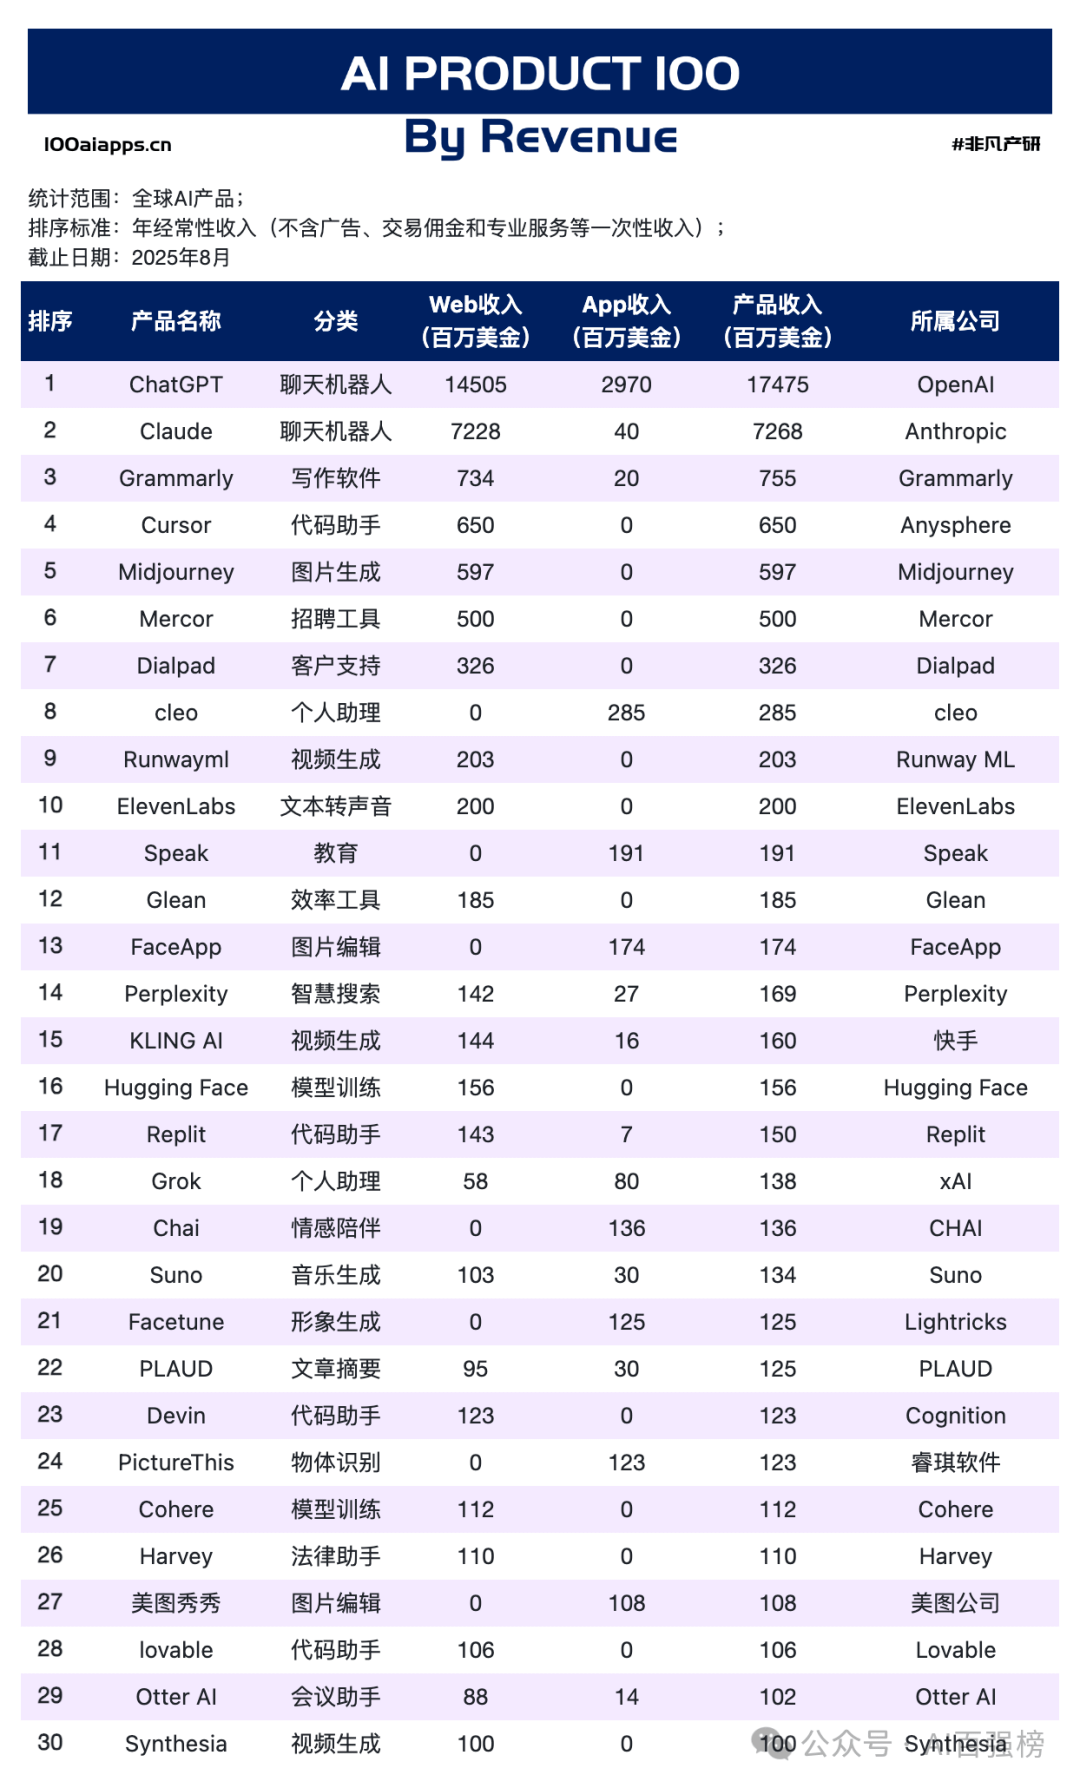
If you aggregate the Global Top 100, August annualized revenue ≈ $33.68B. By channel:
Web: 83.44%
App: 16.55%
Why? Enterprise/general assistants monetize via Web subscriptions & seat licenses (higher price points and larger account sizes), while mobile leans toward consumer tools and lighter scenarios (more fragmented revenue).
By category (share of revenue):
Chatbots: 74.11% (far ahead)
Code assistants: 3.57%
Writing software: 2.39%
Image editing: 2.03%
Image generation: 1.91%
Video generation: 1.75%
Recruiting tools: 1.48%
Personal assistants: 1.37%
Within the Global Top 100 by region/type:
Overseas: $32.521B (96.54%)
Domestic (China-only): $0.237B (0.70%)
China going-global: $0.928B (2.75%)
Overseas (especially a few leading foundation models and their ecosystems) drives the vast majority of revenue; Chinese products in the list skew more toward Apps.
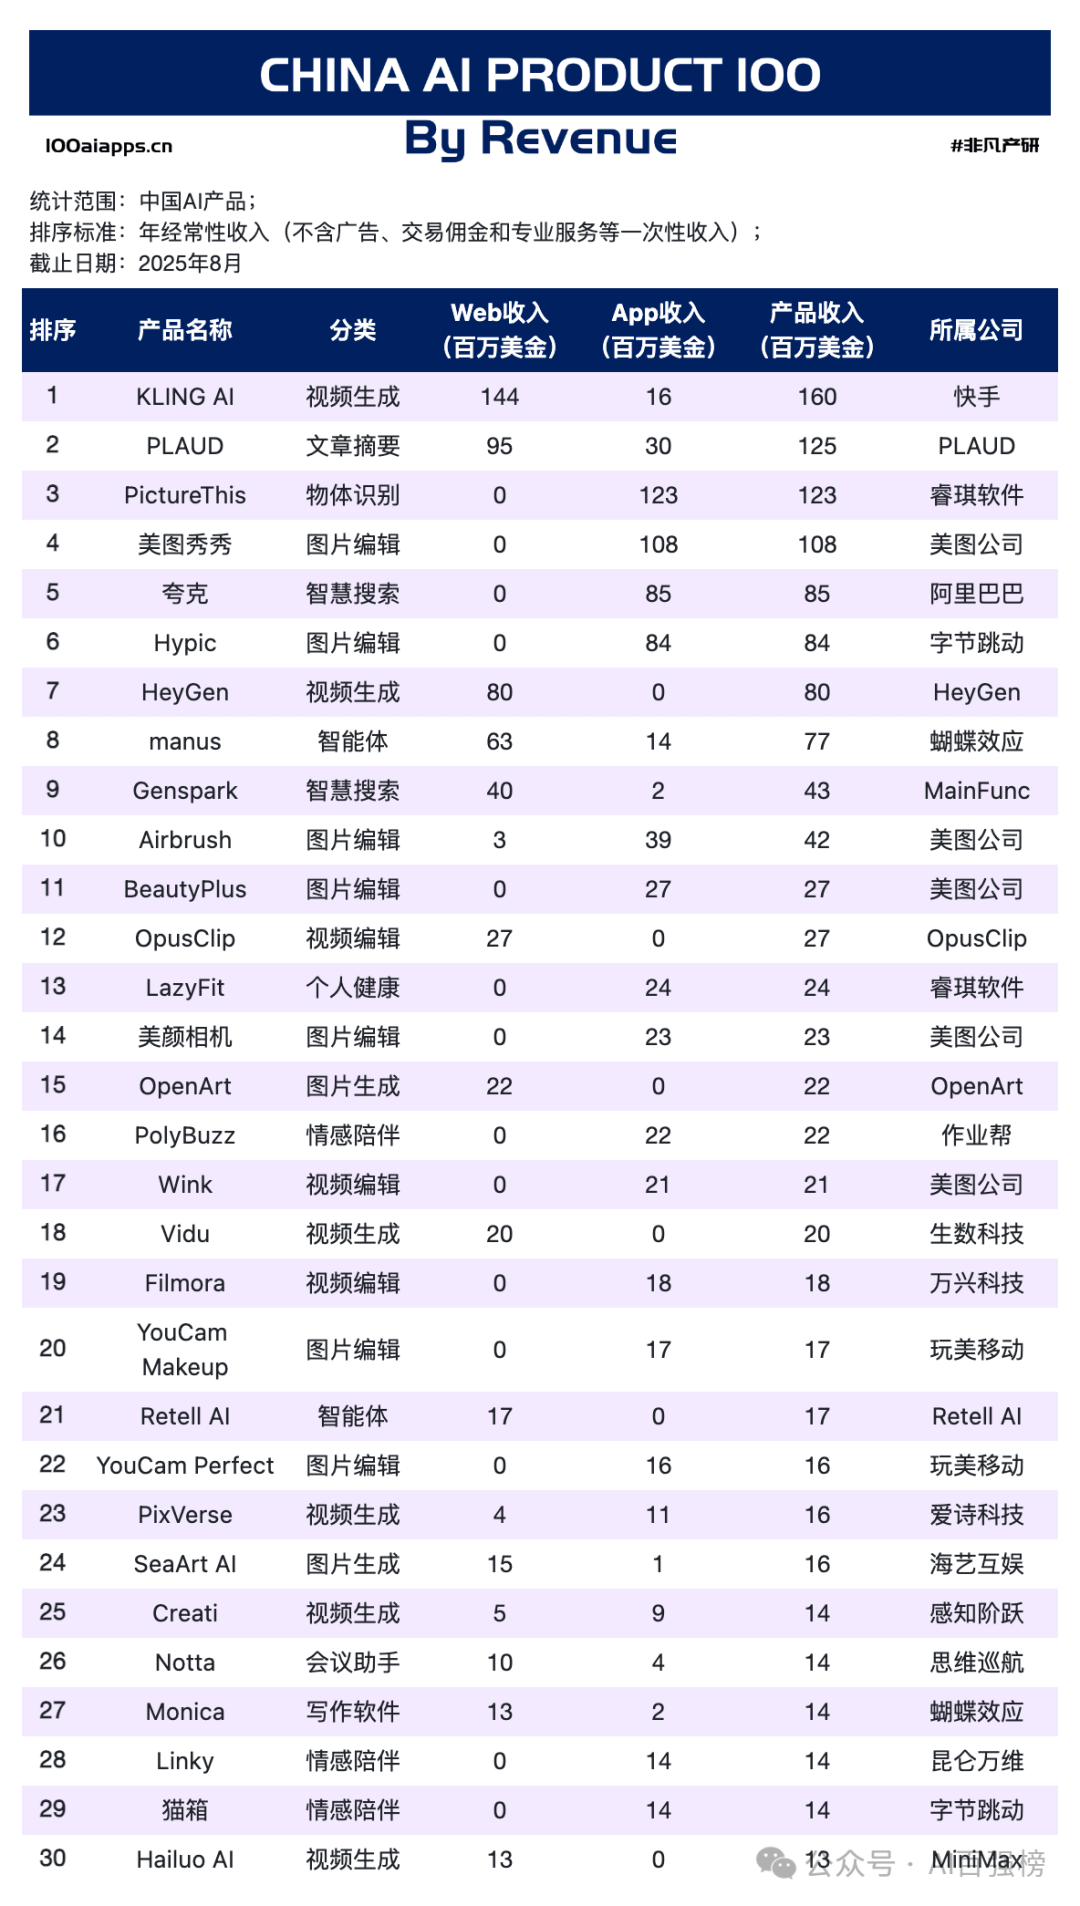
Within China’s AI Top 100:
Total: $1.637B
Going-global: $1.243B (75.93%)
Domestic: $0.394B (24.07%)
In short, over three-quarters of China’s AI app revenue comes from going-global. The most commercializable Chinese products tend to deliver visible efficiency / quantifiable value across languages and cultures (e.g., visual generation, video tools, summarization/transform), and they blend Web + App to widen reach and conversion.
Global Top 100: Web/App = 83.44% / 16.55%
China going-global: Web/App = 55.06% / 44.83% (more balanced than global)
China domestic: ~100% App, concentrated in mobile imaging and content consumption (e.g., Meitu Xiuxiu, BeautyCam, Wink).
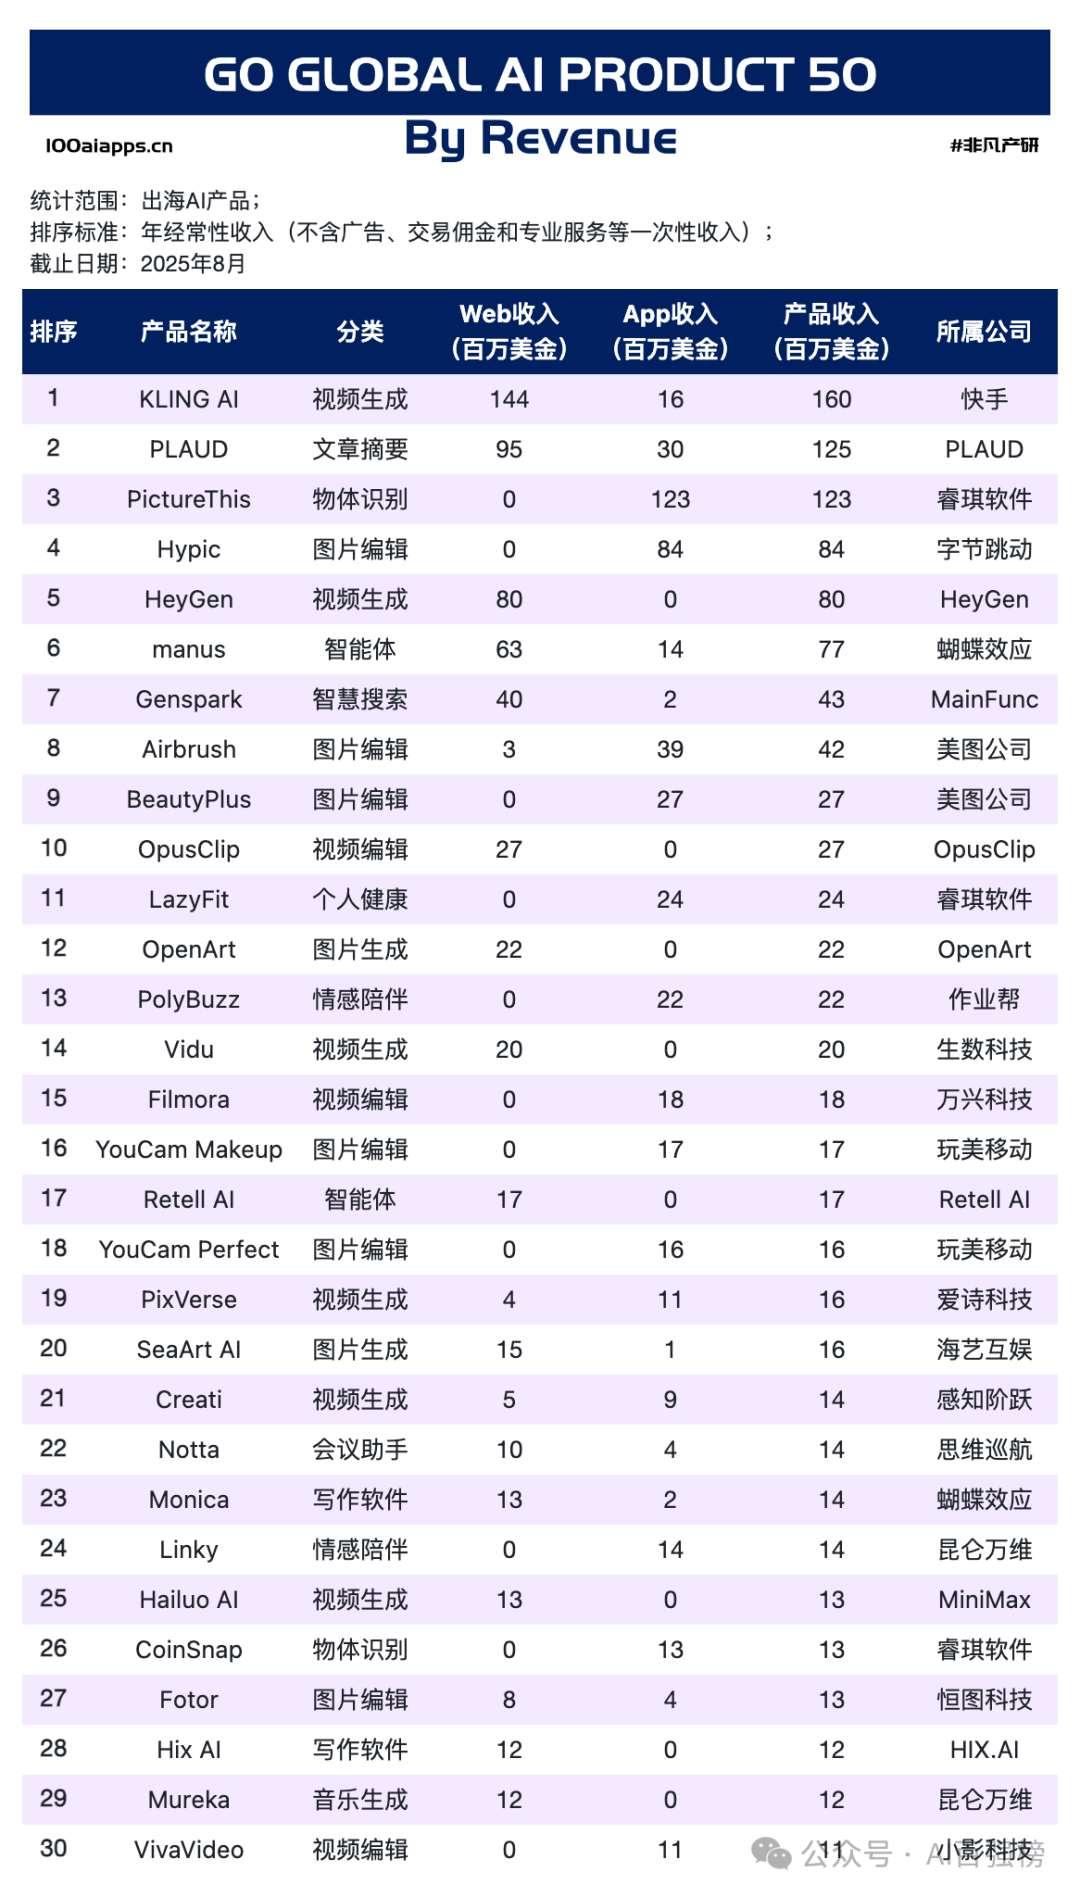
For China going-global products, August annualized revenue ≈ $928M. Category mix:
Video generation (28.02%)
Image editing (18.32%)
Article summarization (13.47%)
Object recognition (13.25%)
Agents (10.13%)
Video editing (4.85%)
Intelligent search (4.63%)
Personal health (2.59%)
Representative products (by revenue, high to low): KLING AI, PLAUD, PictureThis, Hypic, HeyGen, manus, Genspark, Airbrush, OpusClip, BeautyPlus, etc.
Two takeaways:
Visible efficiency travels across languages and cultures—users grasp the value instantly and pay more readily.
Hybrid distribution & pricing: the same company often runs Web subscriptions alongside App subscriptions/IAP, covering desktop high-intent usage and mobile high-frequency micro-tasks.
At the very top of the global stack, ChatGPT and Claude dominate dollar volumes via Web subs, so overseas naturally takes an outsized share. Chinese teams excel in granular scenarios, engineering velocity, and operational efficiency—which scales cash flow faster in C-side image/video/content tools and SMB-oriented light SaaS. Hence going-global shows a more balanced Web/App mix, while domestic remains App-heavy.
Strategically, overseas leaders push platform/ecosystem extension, whereas China going-global compounds through ongoing productization + ops, punching through one measurable micro-scene at a time. Both paths work—just with different focal points.
AI Top 100 detailed lists:
Global AI Product Revenue Ranking
China AI Product Revenue Ranking
China Going-Global AI Product Revenue Ranking
Our reach & recognition: Our data and insights are widely trusted and cited by leading investment institutions, academia, and media as benchmarks for market analysis, investment decisions, and trend tracking. Selected partners/citations include major brokerages/investment banks (e.g., 国金证券、 中信建投、 华源证券、 海通证券) and authoritative media (e.g., 中国证券报、钛媒体、界面新闻).
We believe that only data validated by core industry participants holds long-term value. We also believe in open source and openness. UNIQUE RESEARCH makes three commitments:
AI Top 100 will remain permanently open-sourced and free, with full methodology and raw data supporting end-to-end reproduction.
All data sources are strictly limited to independent third-party monitoring platforms; we do not accept company self-reported numbers as evaluation inputs.
Rankings remain absolutely neutral—we do not accept any commercial deals or payments that could influence results.
Investors/Analysts: A clean, reverse-engineerable baseline for building models, sourcing under-the-radar projects, and cross-validating theses.
AI Founders/Product Managers: Precisely locate competitors and replicate our methodology to analyze your own product’s market performance and optimization roadmap.
Researchers/Students: With full open access, this is a high-quality free dataset for academic work and market studies. We welcome novel research based on it.
Access the full charts and underlying data behind the AI Top 100 at 100aiapps.cn. All visible data is copyable and free for personal study/research (for commercial use, please contact UNIQUE RESEARCH for authorization).
We also welcome listed teams—under compliant use—to reference the rankings in pitch decks, recruiting materials, etc., as authoritative proof of your strength.