At work these days, everyone says they’re “using AI”—to write copy, cut out images, look up facts, translate. It’s lively. But when money actually changes hands, it often happens somewhere else: developers buying APIs, enterprises purchasing seats, creators paying for outcomes. The data keeps repeating this pattern: usage and payment don’t correlate as tightly as intuition suggests.
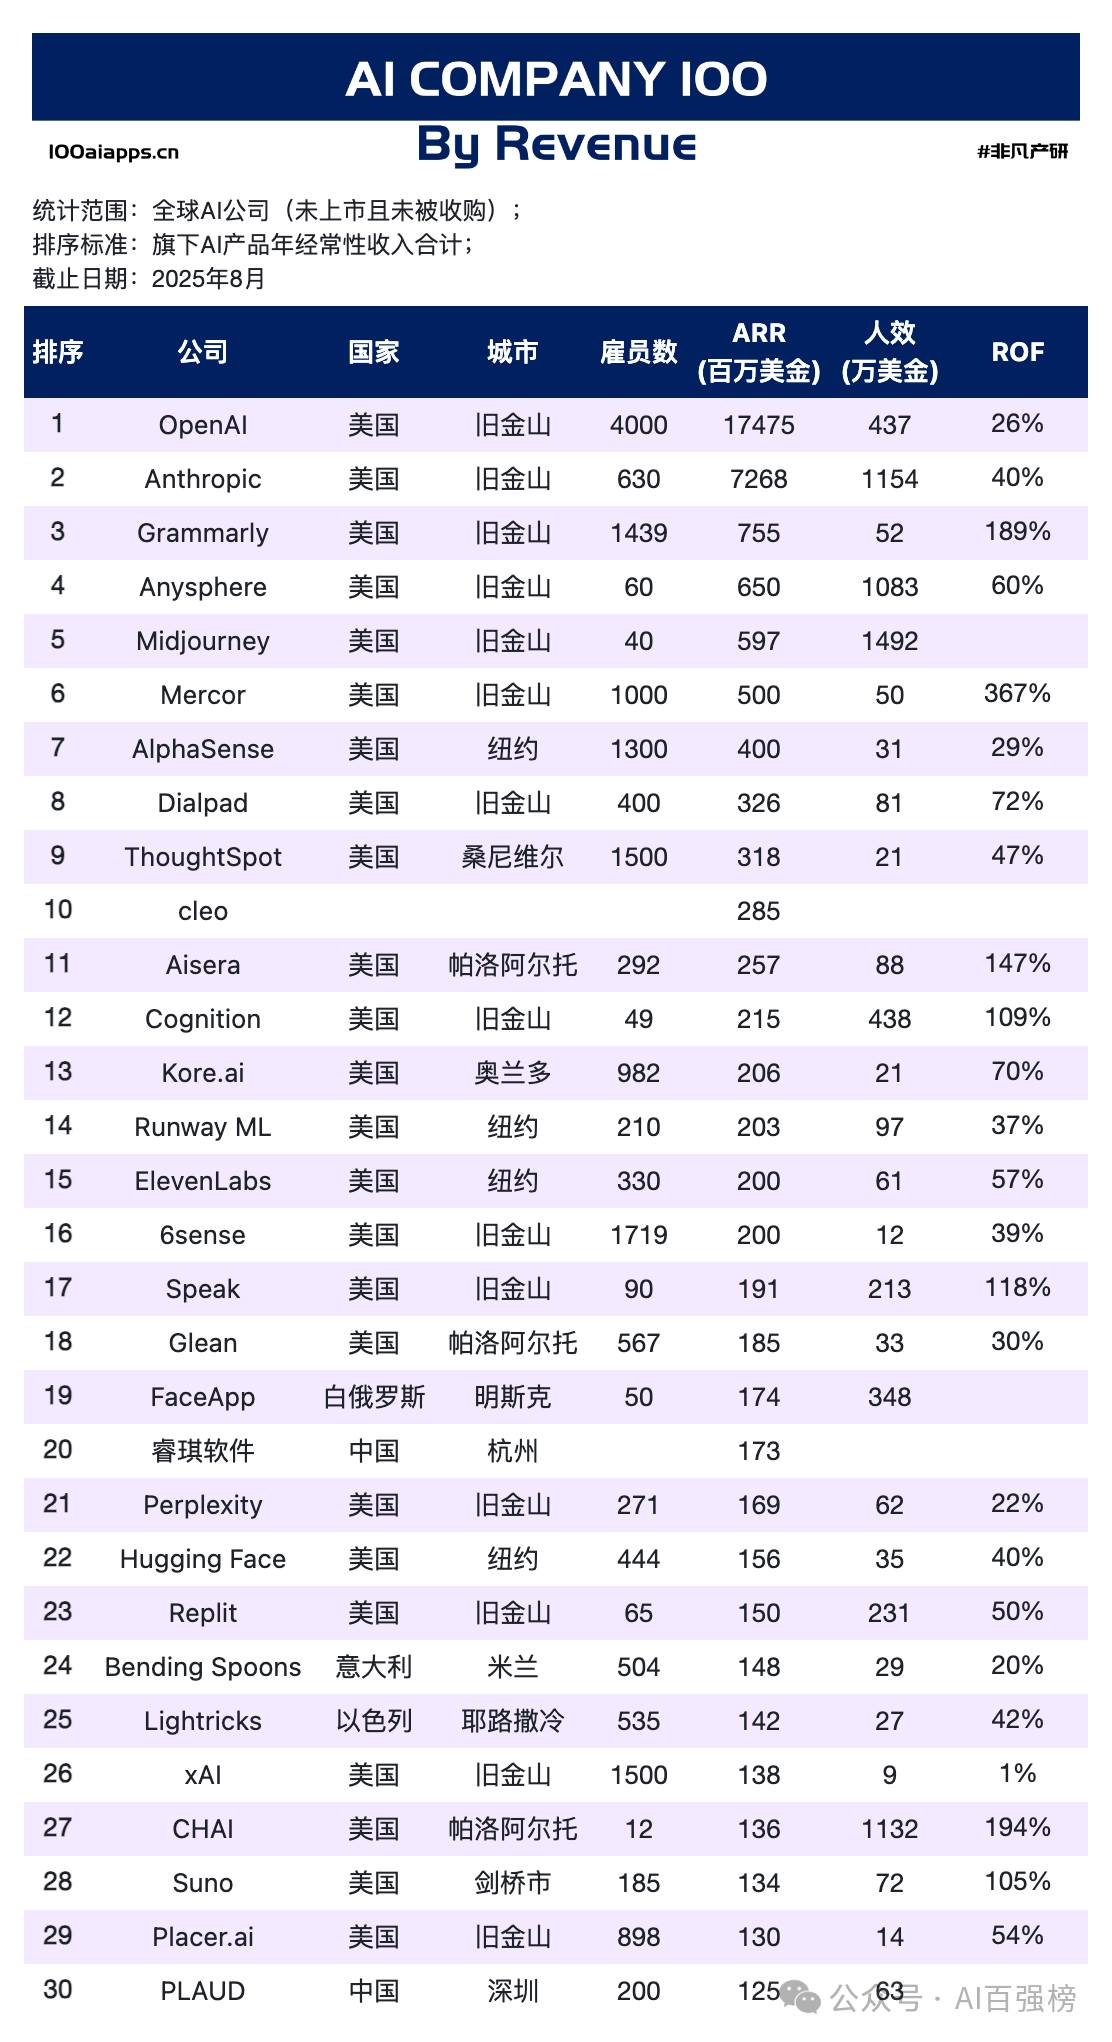
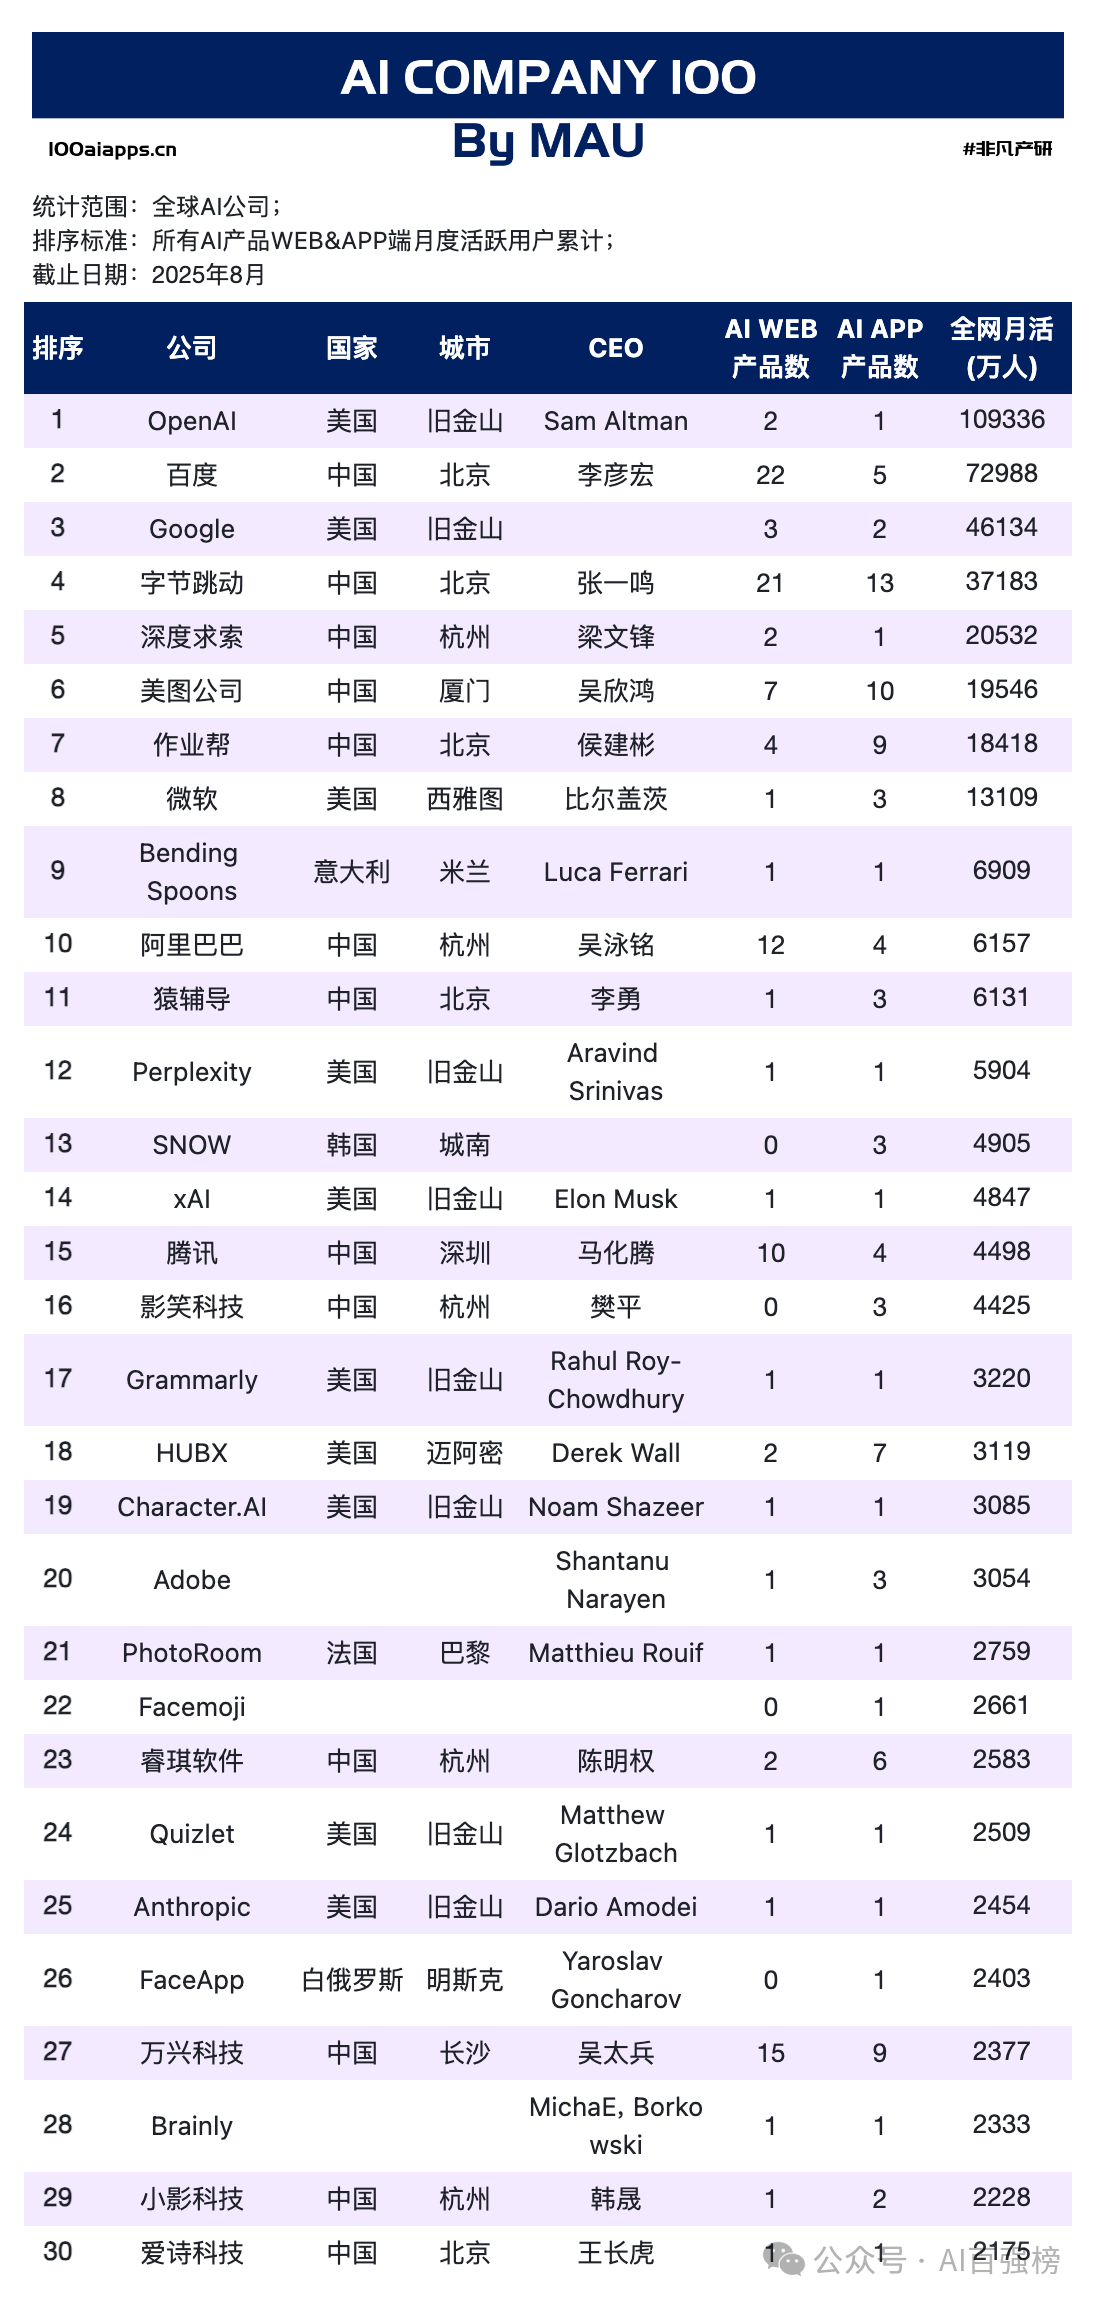
If you only look at user scale, it’s easy to assume: more users → more money. In the Global AI Company MAU chart, Chinese companies account for ~46.0% of worldwide MAUs (the U.S. ~43.2%). Yet in the Global AI Company Revenue Top 100, U.S. companies take ~91.9% of global ARR, while Chinese companies account for just 3.5%.
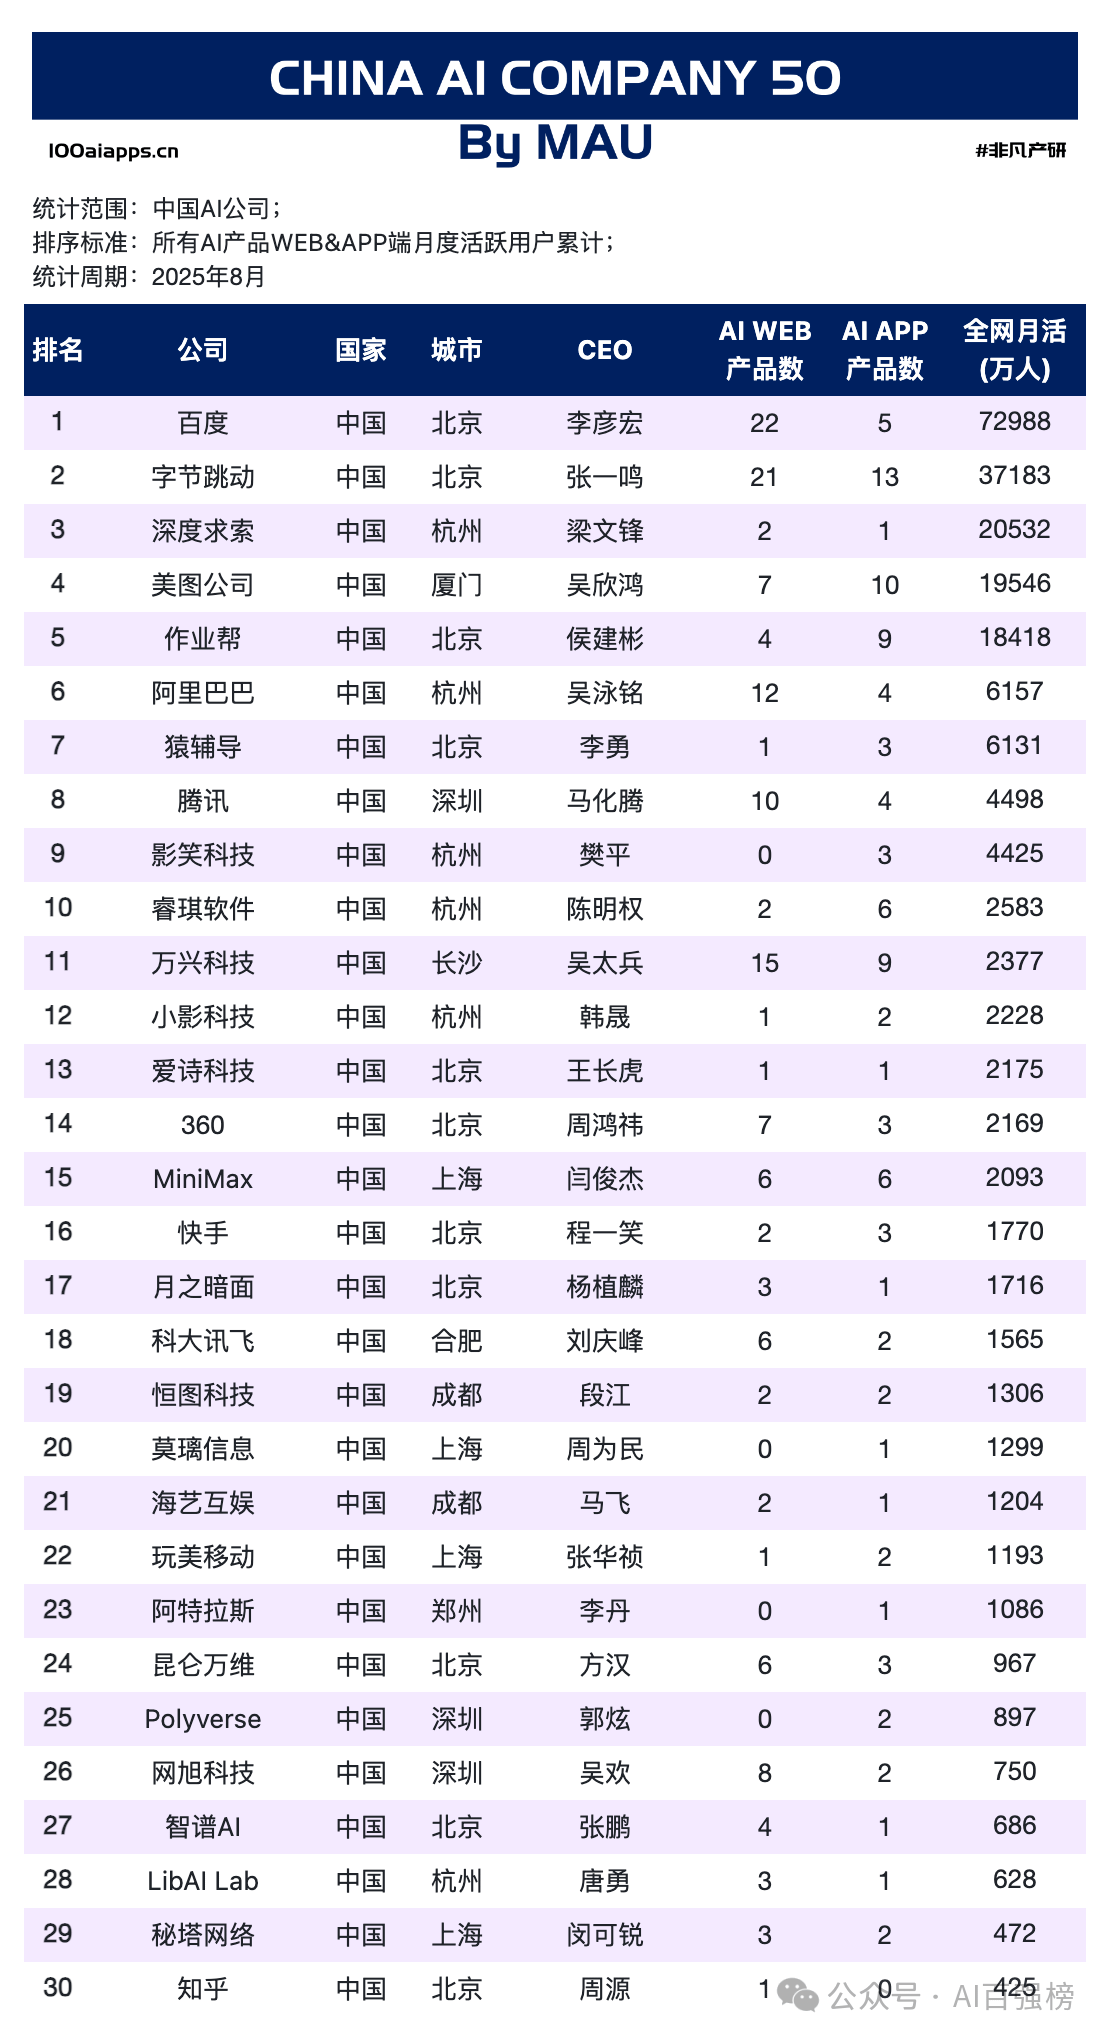
A more visceral comparison: Baidu’s total MAUs are ~730M, ByteDance ~372M, DeepSeek ~205M, Meitu ~195M; on the revenue side, OpenAI alone is at roughly $17.475B ARR, Anthropic about $7.268B, while the entire China revenue list sums to only ~$1.287B.
When traffic and revenue decouple, the true determinant of competitiveness isn’t “Do you have users?” but “In what scenarios—and how—do users pay?”
Read on and you’ll take away three deeper truths:
Revenue structure and paid scenarios explain differences better than sheer user scale;
Product matrices and distribution paths determine reach efficiency and the slope of conversion;
Revenue per employee (human efficiency) and valuation (PS) together sketch the tension curve between capital expectations and cash-flow realization.
Let’s anchor a few clear facts.
(1) Global revenue scale and concentration
As of August, combined global ARR for AI companies is about $36.41B. Concentration is extreme: the Top 10 take ~78.5% of revenue. The top three are OpenAI ($17.475B), Anthropic ($7.268B), and Grammarly ($755M). This is a classic power-law: the leaders shape the entire revenue curve.
(2) Revenue by country
The U.S. dominates at $33.443B (~91.9%). China is around $447M, followed by Canada, the U.K., Israel, etc.
(3) Global users and concentration
Global MAUs are massive; the Top 10 absorb ~73.3%. Leaders include OpenAI (~1.093B), Baidu (730M), Google (461M), ByteDance (372M), DeepSeek (205M), Meitu (195M), Zuoyebang (184M), etc. “Entry-point capabilities + multi-SKU matrices” dramatically expand reach.
Overlay the two maps and one sentence emerges: the U.S. dominates “high-price paid scenarios,” while China dominates “high-frequency reach scenarios.” It’s not about who is “stronger,” but who better converts specific “demand density” into cash flow.
In the Global AI Company MAU view:
Web → lower friction for reach and spread: search entry, social/community linking, light-weight trials → frequent revisit loops, especially for “tool → content → platform” migration.
App → deeper scenario penetration: better for immersion, retention, and monetization, but user acquisition costs and decision friction are higher. Users must need it, afford it, and can’t live without it.
Chinese companies have built a high-efficiency pattern with “multi-SKU + Web-first / linked distribution,” e.g.,
Baidu (Web 22 / App 5), ByteDance (Web 21 / App 13), Meitu (Web 7 / App 10), Zuoyebang (Web 4 / App 9).
This helps explain why Chinese companies sprint ahead on MAUs: # of SKUs × Web distribution increases both the probability of being seen and the frequency of repeat use. But turning being seen into willingness to pay requires a different slope.
Why doesn’t open reach translate into proportional revenue? Two key clues in your data:
First: “Human efficiency” (Revenue per Employee).
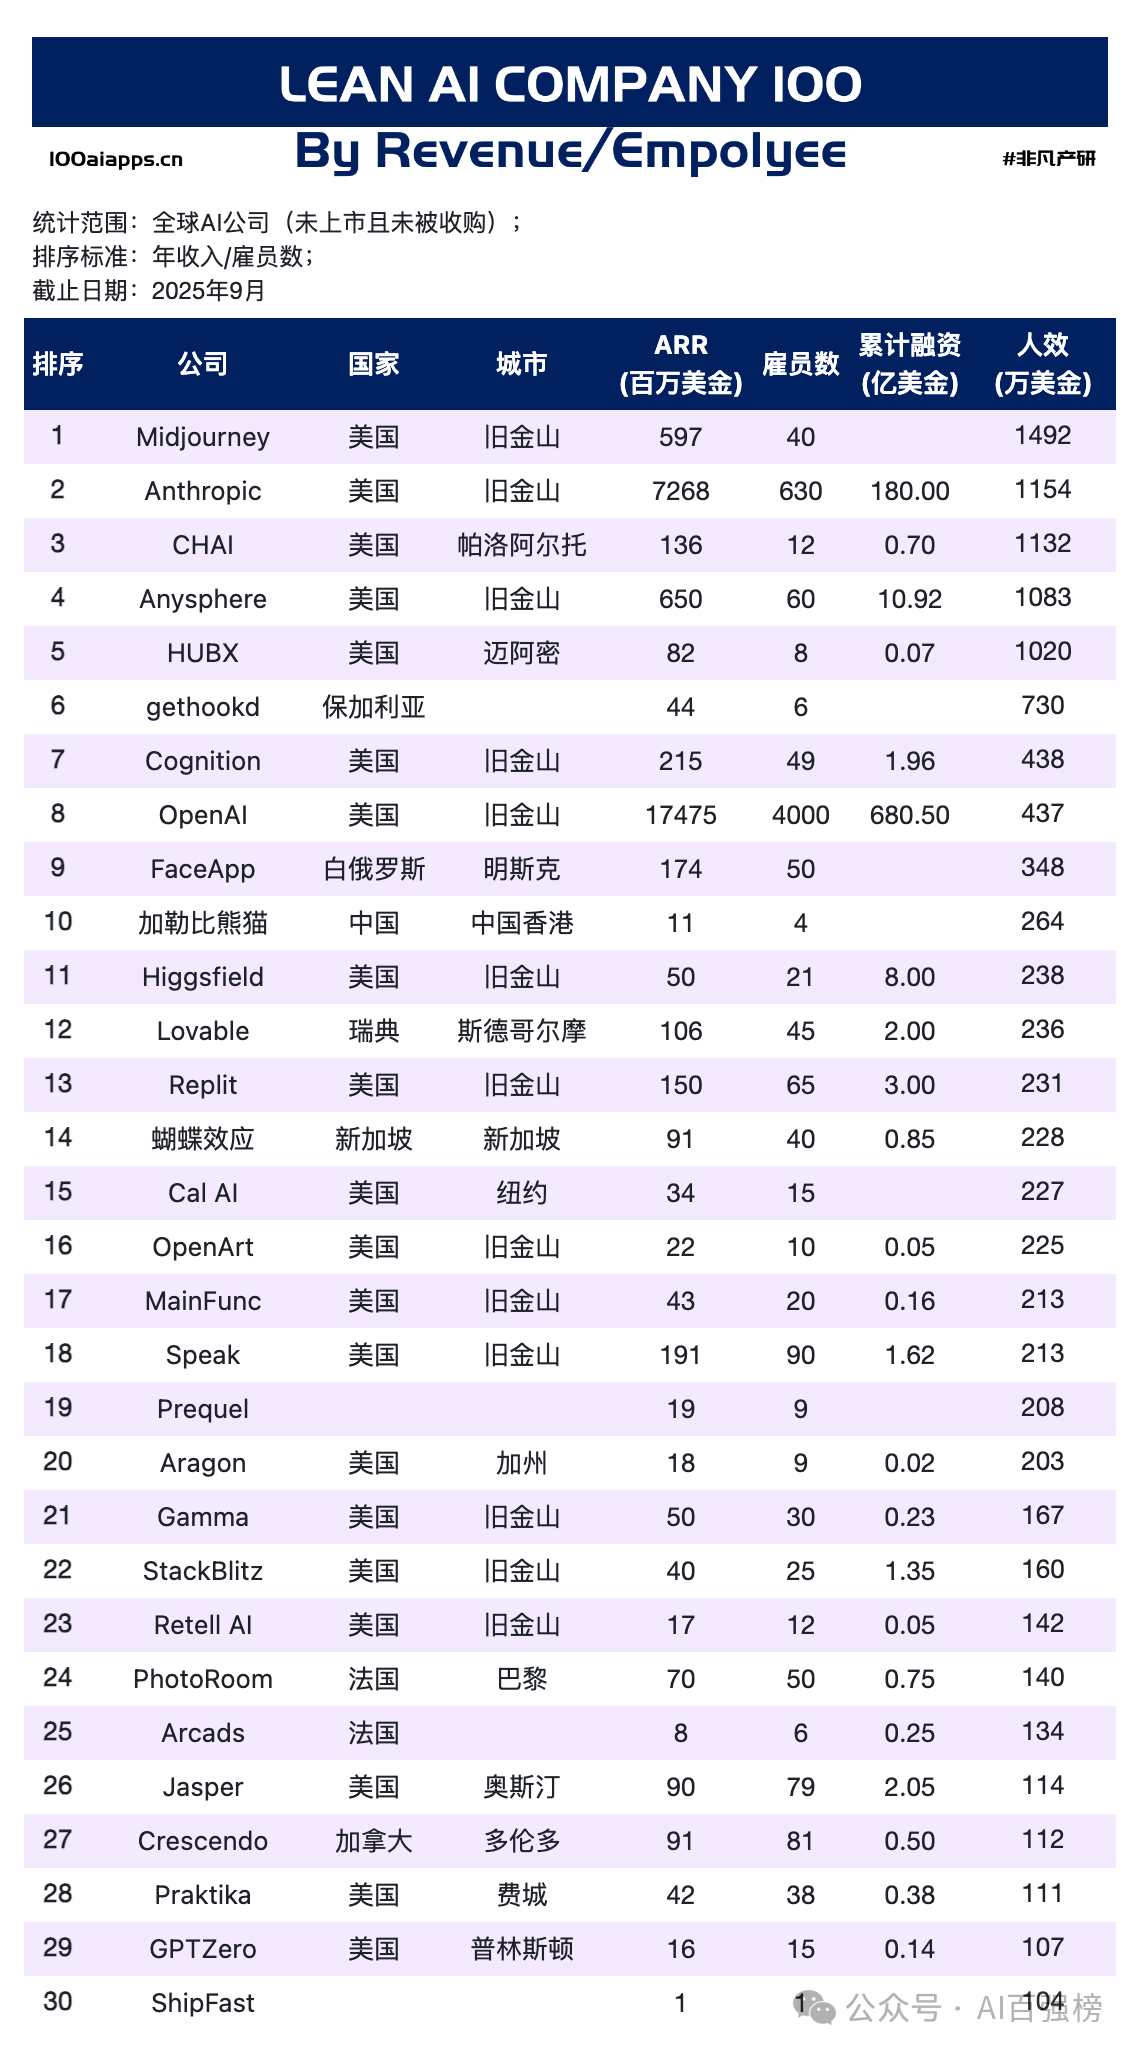
In the RPE leaderboard (revenue/employees, unit $10k per employee), the median is ~60 (≈ $0.60M/employee), the 90th percentile ~240.6 (≈ $2.406M/employee). The very top is piercing:
Midjourney ≈ 1492 (≈ $14.92M/employee)
Anthropic ≈ 1154 (≈ $11.54M/employee)
CHAI ≈ 1132 (≈ $11.32M/employee)
Anysphere ≈ 1083 (≈ $10.83M/employee)
HUBX ≈ 1020 (≈ $10.20M/employee)
OpenAI ≈ 437 (≈ $4.37M/employee)
This isn’t just “lean staffing”—it’s about turning sharp pain points into strong scenarios where users pay high prices, continuously, while a small team delivers stable cash flow. Think strong tools/platforms + high ARPU + highly reusable delivery.
Second: PS and the valuation “expectations lever.”
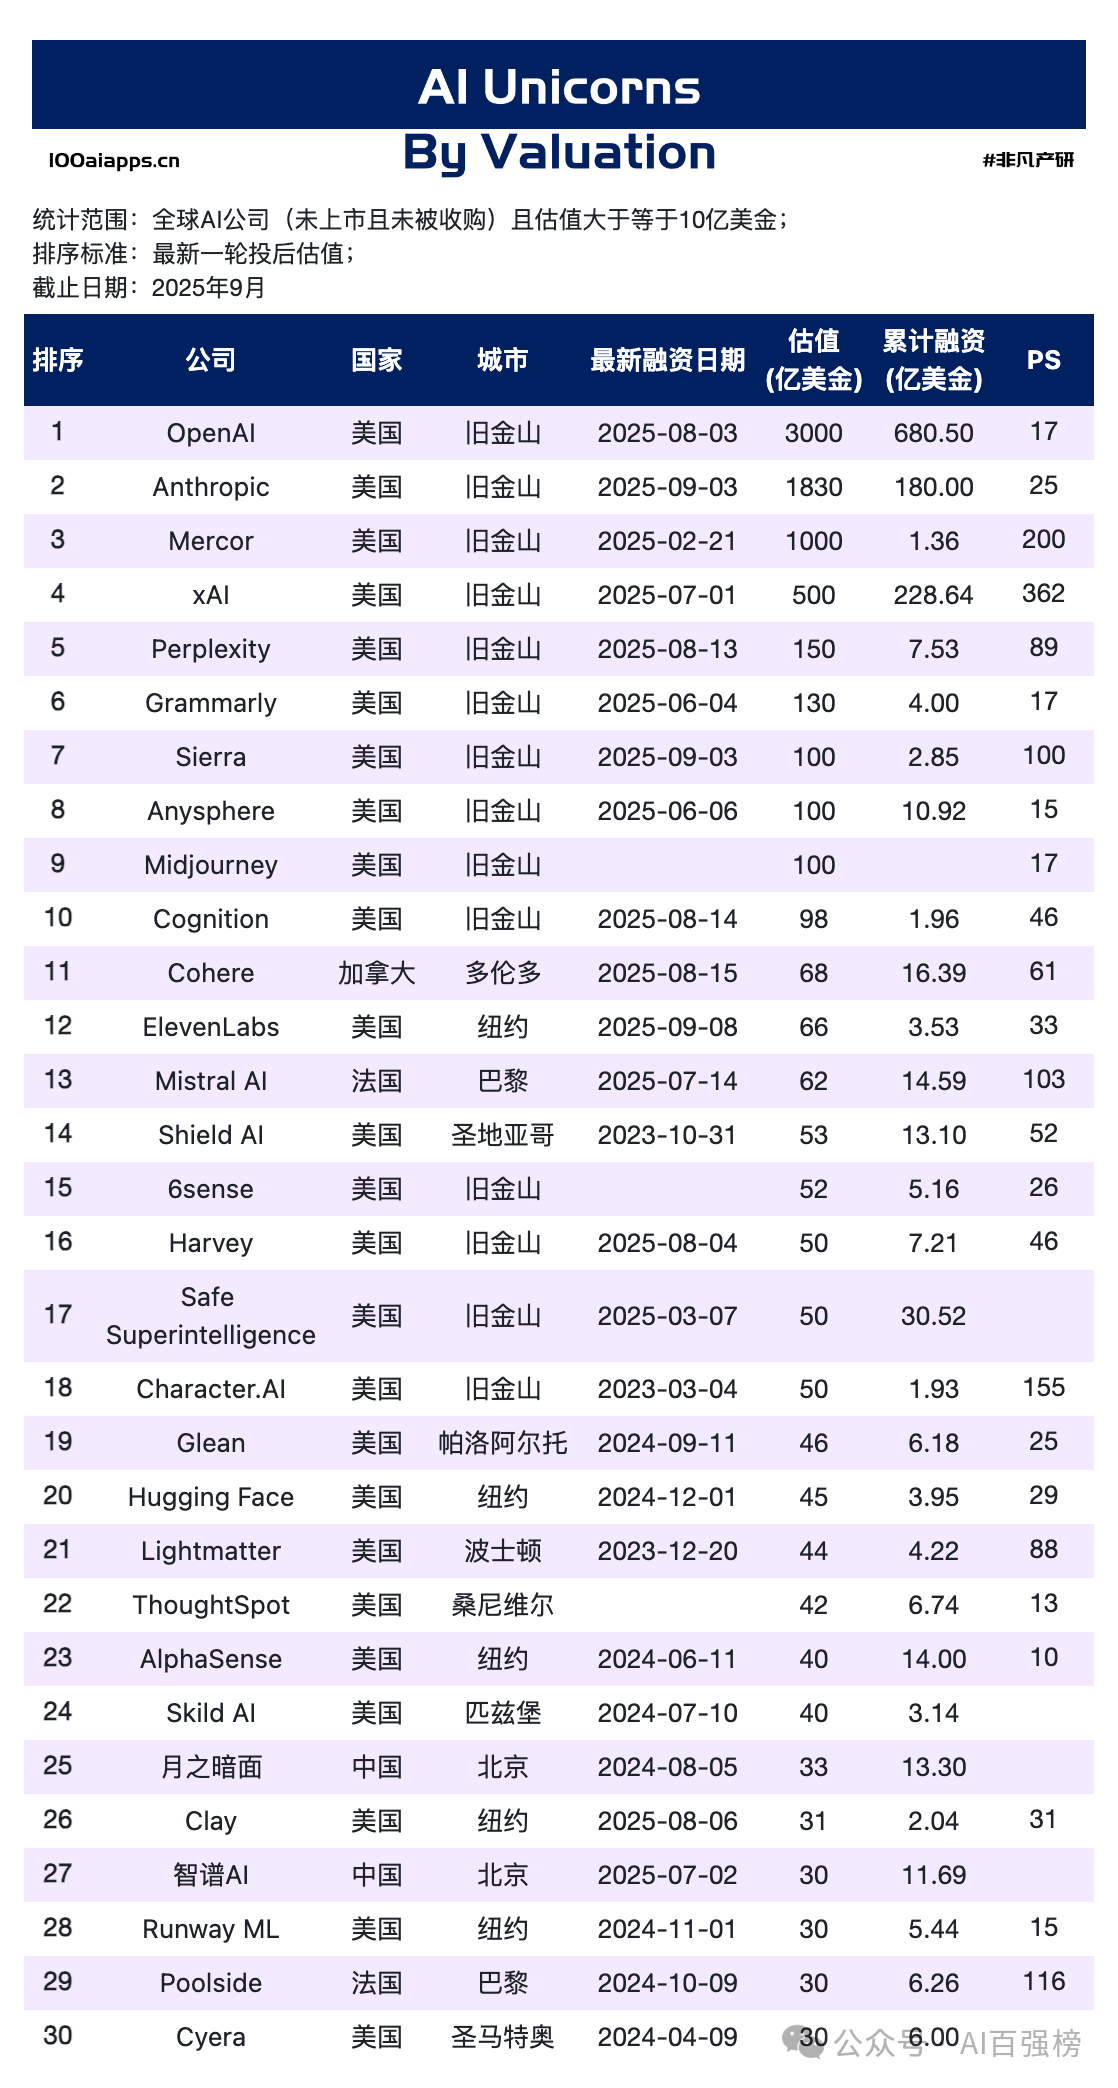
In the Unicorn List (valuation ≥ $1B, September cut), there are ~75 companies with ~$863.6B combined valuation; median PS ≈ 28, ranging from ~5 to 362. Cross-checking valuations with ARR in your table (OpenAI, Anthropic, Perplexity, xAI, Midjourney, Cognition, etc.) shows implied “valuation/revenue” ratios align with PS. Translation: capital pays a multiple above current revenue for cash flows with high growth and extensibility. To deserve that PS, you need two things:
Paid scenarios that are rigid (stable + high ticket size)
A growth slope that compounds (new products/scenarios/channels keep opening)
Putting RPE and PS together yields a steadier explanatory frame: Chinese companies excel at reach efficiency, but must keep backfilling into “high-price, must-have scenarios + high-RPE delivery.” U.S. leaders have already productized scenarios where users are willing to pay high prices.
The Unicorn List shows multiple fresh financings in Aug–Sep. Seen alongside revenue and RPE, one capital behavior is consistent: use higher PS to “pre-buy” companies that have already demonstrated RPE and extensibility. Put differently, when the cash-flow slope is steep enough, time gets priced in.
If you’re ToC, borrow two things from this table:
Web-first + multi-SKU matrix—use low-friction reach to maximize the odds of being seen, then build migrations across SKUs from light → heavy;
Turn strong features into strong scenarios via subscription. Even with a low ticket, if repurchase is stable, RPE emerges. Meitu, ByteDance, and Baidu are mature templates for “matrix reach.”
If you’re ToB, organize from day one around billable, reusable, compounding value:
Write cost-down / revenue-up into the contract; shorten the path from PoC to scaled deployment;
Productize delivery to raise RPE;
Turn “tools” into “process” or “outcomes,” so renewals and expansion happen naturally.
The top RPE samples in your table essentially nail these three.
The August data supports a clear, restrained judgment: today’s AI competition isn’t decided by “Do you have users?” but by “Do you have scenarios that can be priced—and repriced—over time?” Chinese companies are already half a step ahead on reach efficiency; U.S. companies are more complete in high-price, must-have scenarios and platform-level premium. The next step is to connect the two: better productization and pricing design to pour massive reach into compounding cash flows. Capital will keep paying a premium for companies that have already proven RPE and extensibility.
UNIQUE RESEARCH (非凡产研) — A leading authority on global AI market intelligence
Nonpareil Research’s August 2025 AI Company Lists include:
Global AI Company Revenue List
AI Company Coverage: Global Coverage, China Coverage
Global Lean AI Companies List, Global AI Unicorns List
Our influence and recognition: UNIQUE RESEARCH’s data and insights are widely trusted and cited by top-tier investment institutions, academia, and media, serving as key benchmarks for market analysis, investment decisions, and trend forecasting. Partners and citers include (but aren’t limited to):
Brokerages & IBs: GF Securities, CSC Financial, Huayuan Securities, Haitong Securities
Leading media: China Securities Journal, TMTPost, Jiemian News
We believe only data that withstands scrutiny by core industry participants has lasting value.
Our three commitments to openness
AI Top 100 is permanently open-sourced and free, with full methodology and raw data reproducible end-to-end.
Data sources are strictly limited to independent third-party monitoring platforms; we do not accept company self-reported data as evaluation evidence.
The ranking system remains strictly neutral; we do not accept any commercial cooperation or paid behavior that would influence ranking results.
How to use the AI Top 100
Investors/Analysts: a clean, reverse-engineering-proof baseline for building models, surfacing under-the-radar projects, and cross-validation.
AI Founders/Product Managers: precisely locate competitors and fully reproduce our methodology to analyze your own product performance and optimize iteration.
Researchers/Students: full openness makes this an excellent free corpus for academic research and market analysis—we encourage innovative research based on this data.
For the full datasets behind the charts and rankings in the AI Top 100, visit 100aiapps.cn. All visible data can be copied and is free for personal learning and research. For commercial use, please contact UNIQUE RESEARCH for authorization in advance. We welcome teams featured on the lists to use their rankings (compliantly) in pitch decks, hiring materials, and other scenarios as authoritative proof of strength.